
Case Study · B2B SaaS
How We Grew Thompson Solutions to 420% More Organic Revenue
A 14-month engagement combining OmniSEO®, paid acquisition, and conversion rate optimization turning a stagnant pipeline into a predictable revenue engine.
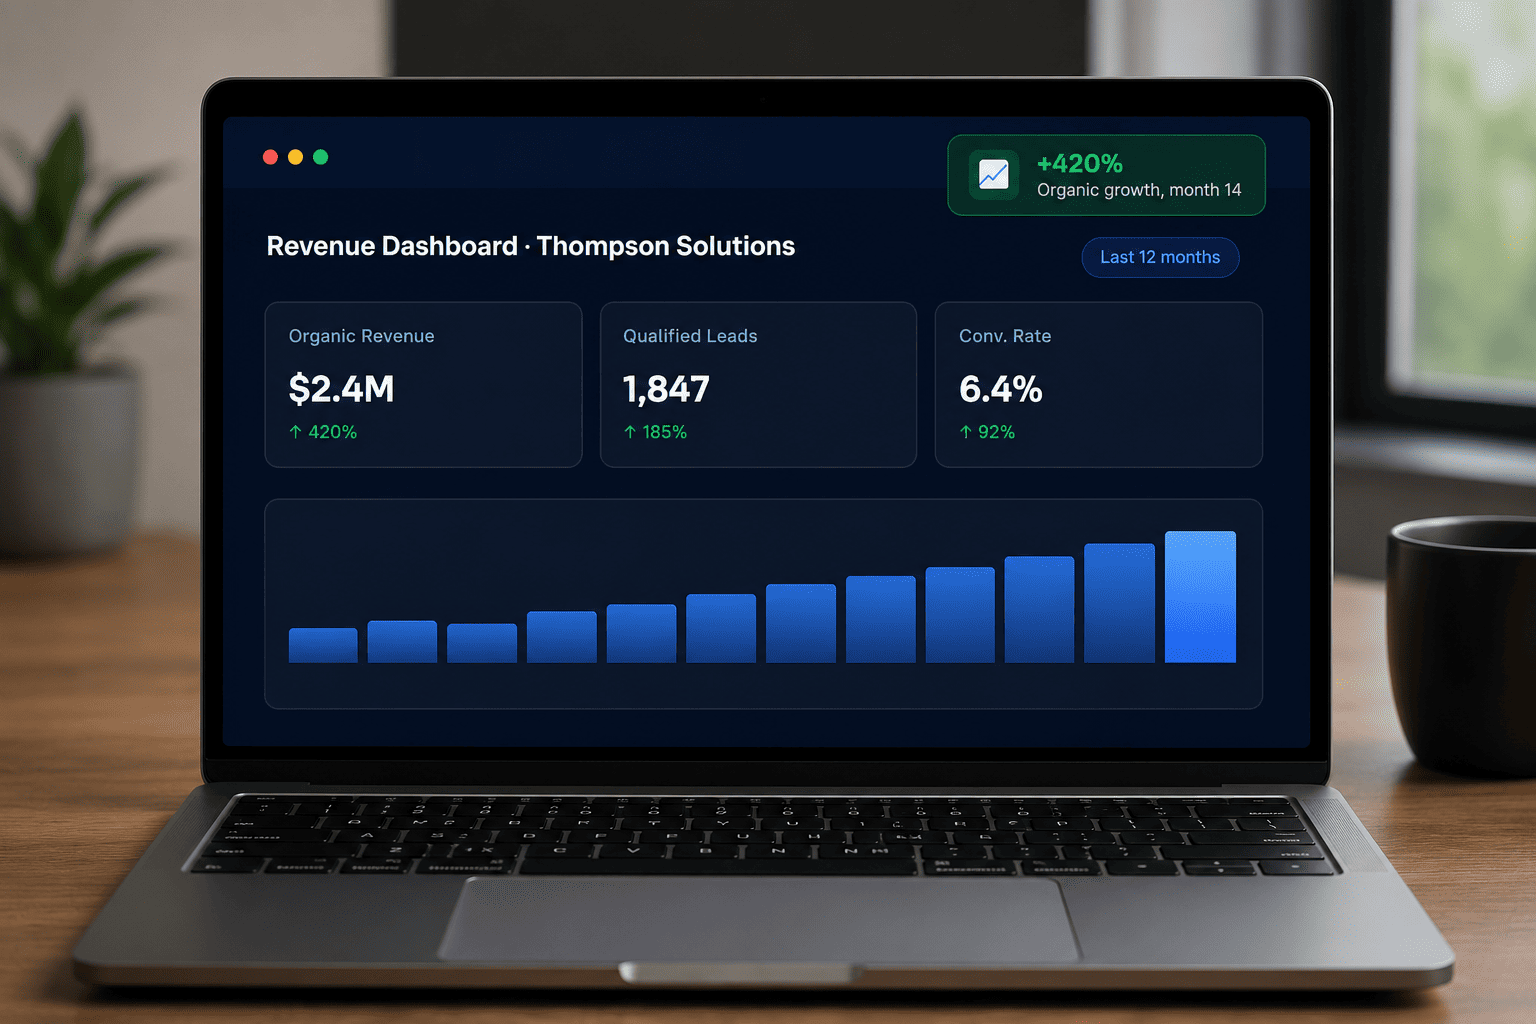
Project Snapshot
The Numbers at a Glance
Client
Thompson Solutions
Engagement
Jan 2024 – Feb 2025
Primary Goal
Pipeline Growth
Market
North America
The Challenge
A Growing Product With a Leaky Funnel
Thompson had a solid product and a sales team but marketing wasn’t delivering predictable pipeline. Here’s what we inherited.
Organic traffic was flat for 18 months
Keyword rankings stagnant; zero structured content strategy
Website converting at under 1.2%
No A/B testing, poor mobile UX, unclear CTAs
Marketing and revenue data were siloed
Marketing and revenue data were siloed
Our Initial Assessment
After a full audit of their tech stack, analytics setup, and content footprint, we identified three root causes: a crawlability issue depressing 40% of indexed pages, a Google Ads account with 200+ broad-match keywords and no negative lists, and a landing page architecture that forced every visitor down the same generic path regardless of intent.
The core opportunity wasn't just traffic it was improving the signal quality of every visitor who landed. Thompson was seeing 22,000 monthly sessions but only 264 MQLs. That math needed to change.
The Strategy
A Phased Revenue Marketing Approach
We don’t launch campaigns we build systems. Each phase creates compounding returns that outlast the engagement.
Foundation & Diagnostics
Phase - 1
Months 1–2
Technical SEO Audit
GA4 Implementation
CRM Attribution
Ads Account Rebuild
OmniSEO® Content Engine
Phase - 2
Months 3–6
Topic Clusters
Programmatic SEO
Link Acquisition
Persona Pages
Paid Acquisition Optimization
Phase - 3
Months 5–10
Google PMax
LinkedIn ABM
Retargeting Funnels
Creative Testing
CRO & Revenue Intelligence
Phase - 4
Months 7–14
A/B Testing
Revenue Dashboard
Pricing Page CRO
Demo Flow Optimization
The Stack Behind the Results
How We Work
Every Engagement Follows This Process
Audit & Discovery
Strategy & Roadmap
Build & Launch
Measure & Attribute
Optimize & Scale
Report & Forecast
Month 1 baseline - Before
Monthly Organic Sessions
22,400
Qualified Leads / Month
264
Demo Conversion Rate
1.2%
Google Ads ROAS
0.8×
Cost Per Lead
$287
Keyword Rankings (Top 10)
31
Domain Authority
34
Month 14 performance- After
Monthly Organic Sessions
113,200
Qualified Leads / Month
748
Demo Conversion Rate
6.4%
Google Ads ROAS
4.1×
Cost Per Lead
$169
Keyword Rankings (Top 10)
247
Domain Authority
58
Before vs. After
The Full Picture of What Changed
Ready to Build Your Own Success Story?
Tell us about your business goals. We’ll audit your current marketing, identify your biggest revenue leaks, and build a custom growth roadmap no fluff, no vanity metrics.
How long did it take to see initial results?
We saw the first meaningful movement in organic traffic by month 3, driven primarily by technical SEO fixes that were suppressing indexed content. Paid acquisition improvements were visible within 60 days of the account restructure. Lead quality improvements became clear in month 4 as we refined audience targeting and landing page messaging.
Did you need to rebuild Thompson's website?
No full rebuild was required. We worked within their existing WordPress stack, creating new landing pages and optimizing existing ones. CRO work focused on the demo form, pricing page, and homepage hero where the conversion leverage was highest. This kept implementation timelines short and avoided months of development cycles.
How was revenue tracking set up?
We implemented Grit Focus’s Revenue Tracking layer connecting GA4, HubSpot CRM, and Google Ads using a server-side GTM setup. Every lead was tagged with first-touch and last-touch attribution, and CRM deal stages were pushed back into the analytics stack so leadership could see which marketing channels were producing closed revenue not just leads.
What budget was required for paid media?
Thompson started with a $18,000/month paid media budget across Google and LinkedIn. By month 6, we shifted allocation based on performance data reducing LinkedIn spend by 30% and reallocating to branded and bottom-funnel Google campaigns that were delivering 4×+ ROAS. The total budget remained stable while returns compounded.
Can similar results be expected for my business?
Every engagement is scoped to your specific baseline, market, and competitive landscape. What we can promise is a rigorous diagnostic process that identifies your highest-leverage opportunities before we spend anything. We only take on clients we believe we can grow and we show you exactly how before you sign.